Imagine you run a team, and somehow this past off-season, you had your pick of any goalie you wanted.
Which goalies make the big clutch saves?
There are times when a team needs the goalie to bail them out. Can we tell which goalies are most likely to rise to the occasion?

The reasons don’t matter; it’s a hypothetical. Maybe it’s some sort of expansion draft, maybe you have great assets to trade, or maybe they’ve all hit free agency at once for some reason. Forget about their contracts and their age, and just think about who you’d most want to have for the coming season.
Would your top five have looked like this: 1) Jonas Hiller, 2) Tuukka Rask, 3) Niklas Backstrom, 4) Marc-Andre Fleury, 5) Ilya Bryzgalov?
Would you have ranked Steve Mason ahead of Tim Thomas? Brian Elliott ahead of Carey Price? Ondrej Pavelec ahead of Pekka Rinne? I don’t think I would’ve.
The Big Save
Many people will tell you that the number of saves a goalie doesn’t matter; the key question is whether he can make the big timely save and bail his team out when they really need him to.
An agent named Jay Grossman seems to subscribe to that theory. On Monday, he said that most of what you need to know about a goalie is his save percentage on close-range shots in high-pressure situations.
So I did what I do in these situations: I pulled the data to see whether there was any truth to this.
For starters, I needed some definitions. What’s a close-range shot? What’s a high-pressure situation? For my first pass, I defined things as follows:
- Close-range shot: anything inside 25 feet
- High-pressure situation: overtime or last ten minutes of the third period, in a tie game or with a one-goal lead
I pulled four years’ numbers, from the 2009-10 season through the 2012-13 season. The rankings I referred to above are for the four-year total of save percentage on close-range clutch shots, using these definitions.
Next, I wanted to see if my definitions had a big impact on the results. I looked at saying a shot was close-range only if it was within 20 feet, or at saying high-pressure situations included plays where the goalie’s team was down by a goal.
In each case, the resulting top five was pretty different from the general consensus. Regardless of which definition I used, Bryzgalov was the only goalie in our Big Save top five to be a Vezina finalist in this timespan; Rask was the only goalie with a top-10 cap hit to crack our Big Save leaderboard.
So if we’re going to take Grossman at face value, it would seem we have to think he’d pick Bryzgalov ahead of Henrik Lundqvist.
A rudimentary assessment
When numbers give a surprising result, that doesn’t mean they’re wrong. It does, however, mean that we’ll need some compelling proof that the numbers are worth paying attention to. Can we really tell which goalies are most likely to make The Big Save?
I’ll take a little bit of a stat-guy look in a minute, but I think just skimming the list makes the answer pretty clear. For example...
Fleury made 74 out of 75 clutch saves and 27 out of 28 close-range clutch saves in 2011-12. Anyone who placed their bets on the basis of that clutch performance was likely surprised and disappointed when he gave up 26 goals in six playoff games -- a 83.4 percent save percentage and 4.63 goals against average.
James Reimer’s 94.2 percent clutch save percentage is among the very highest four-year totals, but he didn’t make the clutch saves in last year’s epic game seven meltdown. Three-time Stanley Cup winner Martin Brodeur was second-lowest in both clutch and close-range clutch save percentage (among goalies with at least 2000 shots faced).
There are a lot of results that look fishy, but we really ought to take a comprehensive look before we pass judgment. We’ll look at whether close-range clutch save percentage over the first two years of our timespan does us any good when it comes to predicting how they’ll do in the next two years:
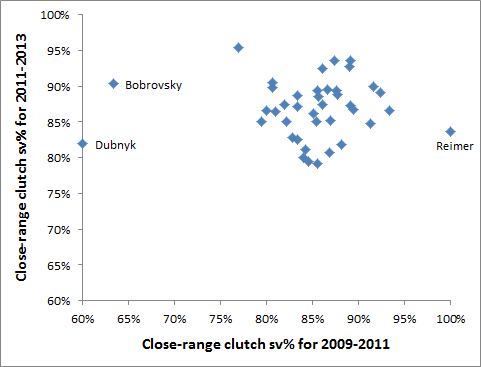
If this stat were a good predictor of future performance, we’d see the dots falling on a diagonal line. Players who were bad in the first two years would be bad in the next two and fall in the bottom-left part of the plot; players who were good in the first two would be good in the next two and fall in the top-right.
Instead, we see a big blob; knowing a goalie’s save percentage on close-range clutch shots in the first two years is essentially worthless as a predictor of how they’ll do in the next two. Devan Dubnyk and Reimer were as far apart as you can get in the first two years and were separated by less than a single save over the next two.
I think we have to conclude that this stat isn’t really of any use at all.
The post-mortem
I didn’t bring this up just to tear down some random agent’s misconception. The reason I thought this was worth writing about is that it relates to a couple of concepts that have been recurring themes with this blog.
1) Demand proof. Lots of things sound good on paper, but our intuition just isn't that great about these things. For any approach you might consider using in your evaluations -- including the ones you're long-accustomed to -- you should expect there to be evidence that it's a useful predictor of future outcomes.
2) Don't overlook random chance. Some people hate thinking about sports in these terms. But we all know that a guy who makes 50 percent of his free throws doesn't make exactly 50 percent in any given game. He'll make more some nights and fewer in others; the long-run average will be 50 percent, but over the short term there will be all kinds of unpredictable hot and cold streaks.
Some goalies might be more clutch than others. But in a world where the difference between an elite goalie and an average one is a few saves per thousand shots, there’s no way we’re going to tell the difference over the ~40-60 close-range clutch shots the average starter faces in a year.
Which brings us to Jay’s other comment on the subject (and a third recurring theme of this blog):
New Year's Resolution for all advanced stats guys: figure out not only what the numbers can explain, but what they can't
— Jay Grossman (@Jay_Grossman) December 23, 2013 Obviously there’s a range of people in any population, but I’d argue that any stat guy worth his salt knows the weaknesses and limitations of his stats very very well. I don’t understand why so many people assume the opposite to be true. Studying what the limitations are and finding ways to improve things is a big part of what we do.
After all, it wasn’t a stat guy who declared that we should evaluate goalies primarily on save percentage on close-range shots in high-pressure situations.
See More:


