It’s always interesting to check out win probability graphs, no matter the sport. Looking back on the swings in momentum, plays that had a significant affect on the outcome of the game and just how in-control a matchup was at any given time can paint a fun picture of what happened. Such is the case for Saturday’s NFL playoff matchups, which took two drastically different paths to their outcomes.
NFL Playoffs 2012: Fun Win Probability Graphs From Saturday’s Games
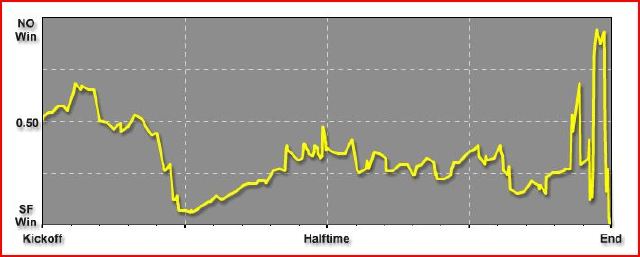
In the other, a wild last few minutes caused peaks and valleys on the win probability chart, lending a visual aid to the drama taking place in San Francisco. The 49ers won, sure, but what a finish it was.
First up, the Niners win over the Saints. Look at the spikes at the end:
And then there was the Patriots win over the Broncos. By halftime, the game was basically over in a statistical sense.

Graphs courtesy of Advanced NFL Stats.
See More:


